sflow-rt + Vizceral
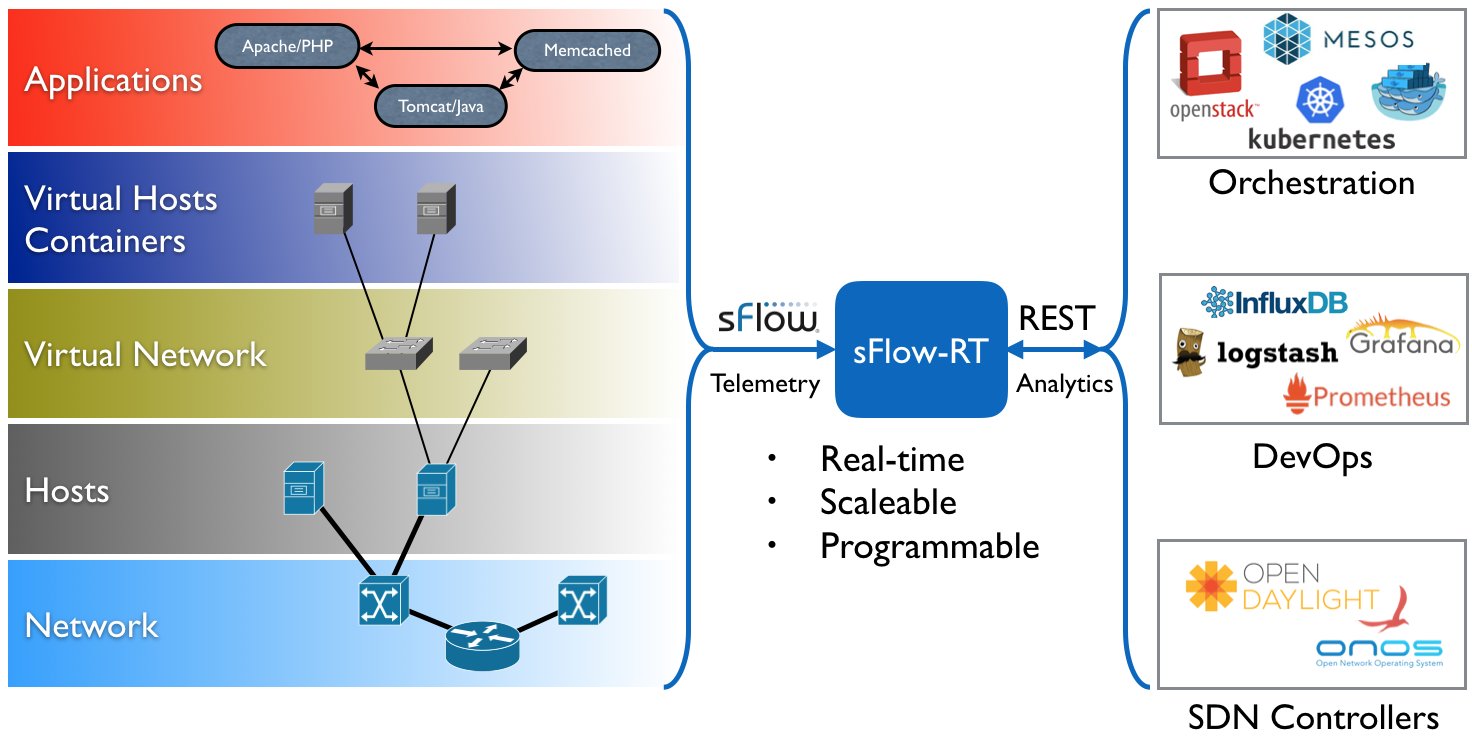
sflow-rt
- ネットワークデバイス、ホスト、およびアプリケーションに埋め込まれたsFlowエージェントからsflowの情報を集計し、監視系ソフトウェアはsflow-rtのREST APIを叩くことでsflowの値を監視できる
hsflowd
- Host Sflow
-
sFlowプロトコルを使用して物理サーバーと仮想サーバーのパフォーマンスメトリックをエクスポート
-
hsflowdをansibleで複数マシンをインストール (ubuntu 1804)
roles/sflow/tasks/main.yml
- name: Download hsflowd deb package
  get_url:
    url: "https://github.com/sflow/host-sflow/releases/download/v{{ hsflowd_version }}/hsflowd-ubuntu18_{{ hsflowd_version }}_amd64.deb"
    dest: "/tmp/hsflowd.deb"
    retries: 5
    delay: 2

    - name: Install hsflowd deb
    apt:
        deb: /tmp/hsflowd.deb

    - name: Copy the hsflowd config file
    copy:
        src: hsflowd.conf
        dest: /etc/hsflowd.conf
        owner: root
        group: root
        mode: 0644

    - name: Enable hsflowd service
      systemd:
        name: hsflowd.service
        enabled: yes
        state: restarted
        daemon_reload: yes
/etc/hsflowd/hsflowd.conf
# hsflowd configuration file
# http://sflow.nehost-sflow-linux-config.php

sflow {
# ======  Agent IP selection ======
# Selection is automatic, unless:
# (1) override with preferred CIDR:
#   agent.cidr = 192.168.0.0/16
# (2) Override with interface:
#   agent = eth0

# ====== Sampling/PollinCollectors ======
# EITHER: automatic (DNS SRV+TXfrom _sflow._udp):
#   DNS-SD { }
  DNSSD = off
# OR: manual:
#   Counter Polling:
  polling = 20
#   default sampling N:
  sampling = 400
#   sampling N on interfaces witifSpeed:
#     sampling.100M = 100
#     sampling.1G = 1000
#     sampling.10G = 10000
#     sampling.40G = 40000
#   sampling N for apache, nginx:
#     sampling.http = 50
#   sampling N for applicatio(requires json):
#     sampling.app.myapp = 100
#   collectors:
  collector { ip=<sflow-rt iaddress> udpport=6343 }
#   add additional collectors here

# ====== Local configuration ======
# listen for JSON-encoded input:
#   json { UDPport = 36343 }
# PCAP+BPF packet-sampling:
#   Bridge example:
#     pcap { dev = docker0 }
#   NIC example:
#     pcap { dev = eth0 }
#     pcap { dev = eth1 }
#   All NICs example:
#     pcap { speed=1G-1T }
  pcap { speed=1- }
# NFLOG packet-sampling:
#   nflog { group = 5  probabilit= 0.0025 }
# ULOG packet-sampling:
#   ulog { group = 1  probability 0.0025 }
# PSAMPLE packet-sampling:
#   psample { group = 1 }
# Nvidia NVML GPU monitoring:
#   nvml { }
# Xen hypervisor and VM monitoring:
#   xen { }
# Open vSwitch sFlow configuration:
#   ovs { }
# KVM (libvirt) hypervisor and Vmonitoring:
#   kvm { }
# Docker container monitoring:
#   docker { }
# TCP round-trip-time/loss/jitte(requires pcap/nflog/ulog)
  tcp { }
# monitoring of systemd cgroups
#   systemd { }
# DBUS agent
#   dbus { }
# Learn config from Arista EAPI
#   eapi { }
}
Vizceral
- Vizceral
- NetflixのOSS
- WebGL
-
webglキャンバスに交通データを表示するためのコンポーネントです
- トラフィック量に関するデータを含むノードとエッジのグラフが提供される場合、ノード間の接続量をアニメーション化するトラフィックグラフをレンダリングする

- トラフィック量に関するデータを含むノードとエッジのグラフが提供される場合、ノード間の接続量をアニメーション化するトラフィックグラフをレンダリングする
-
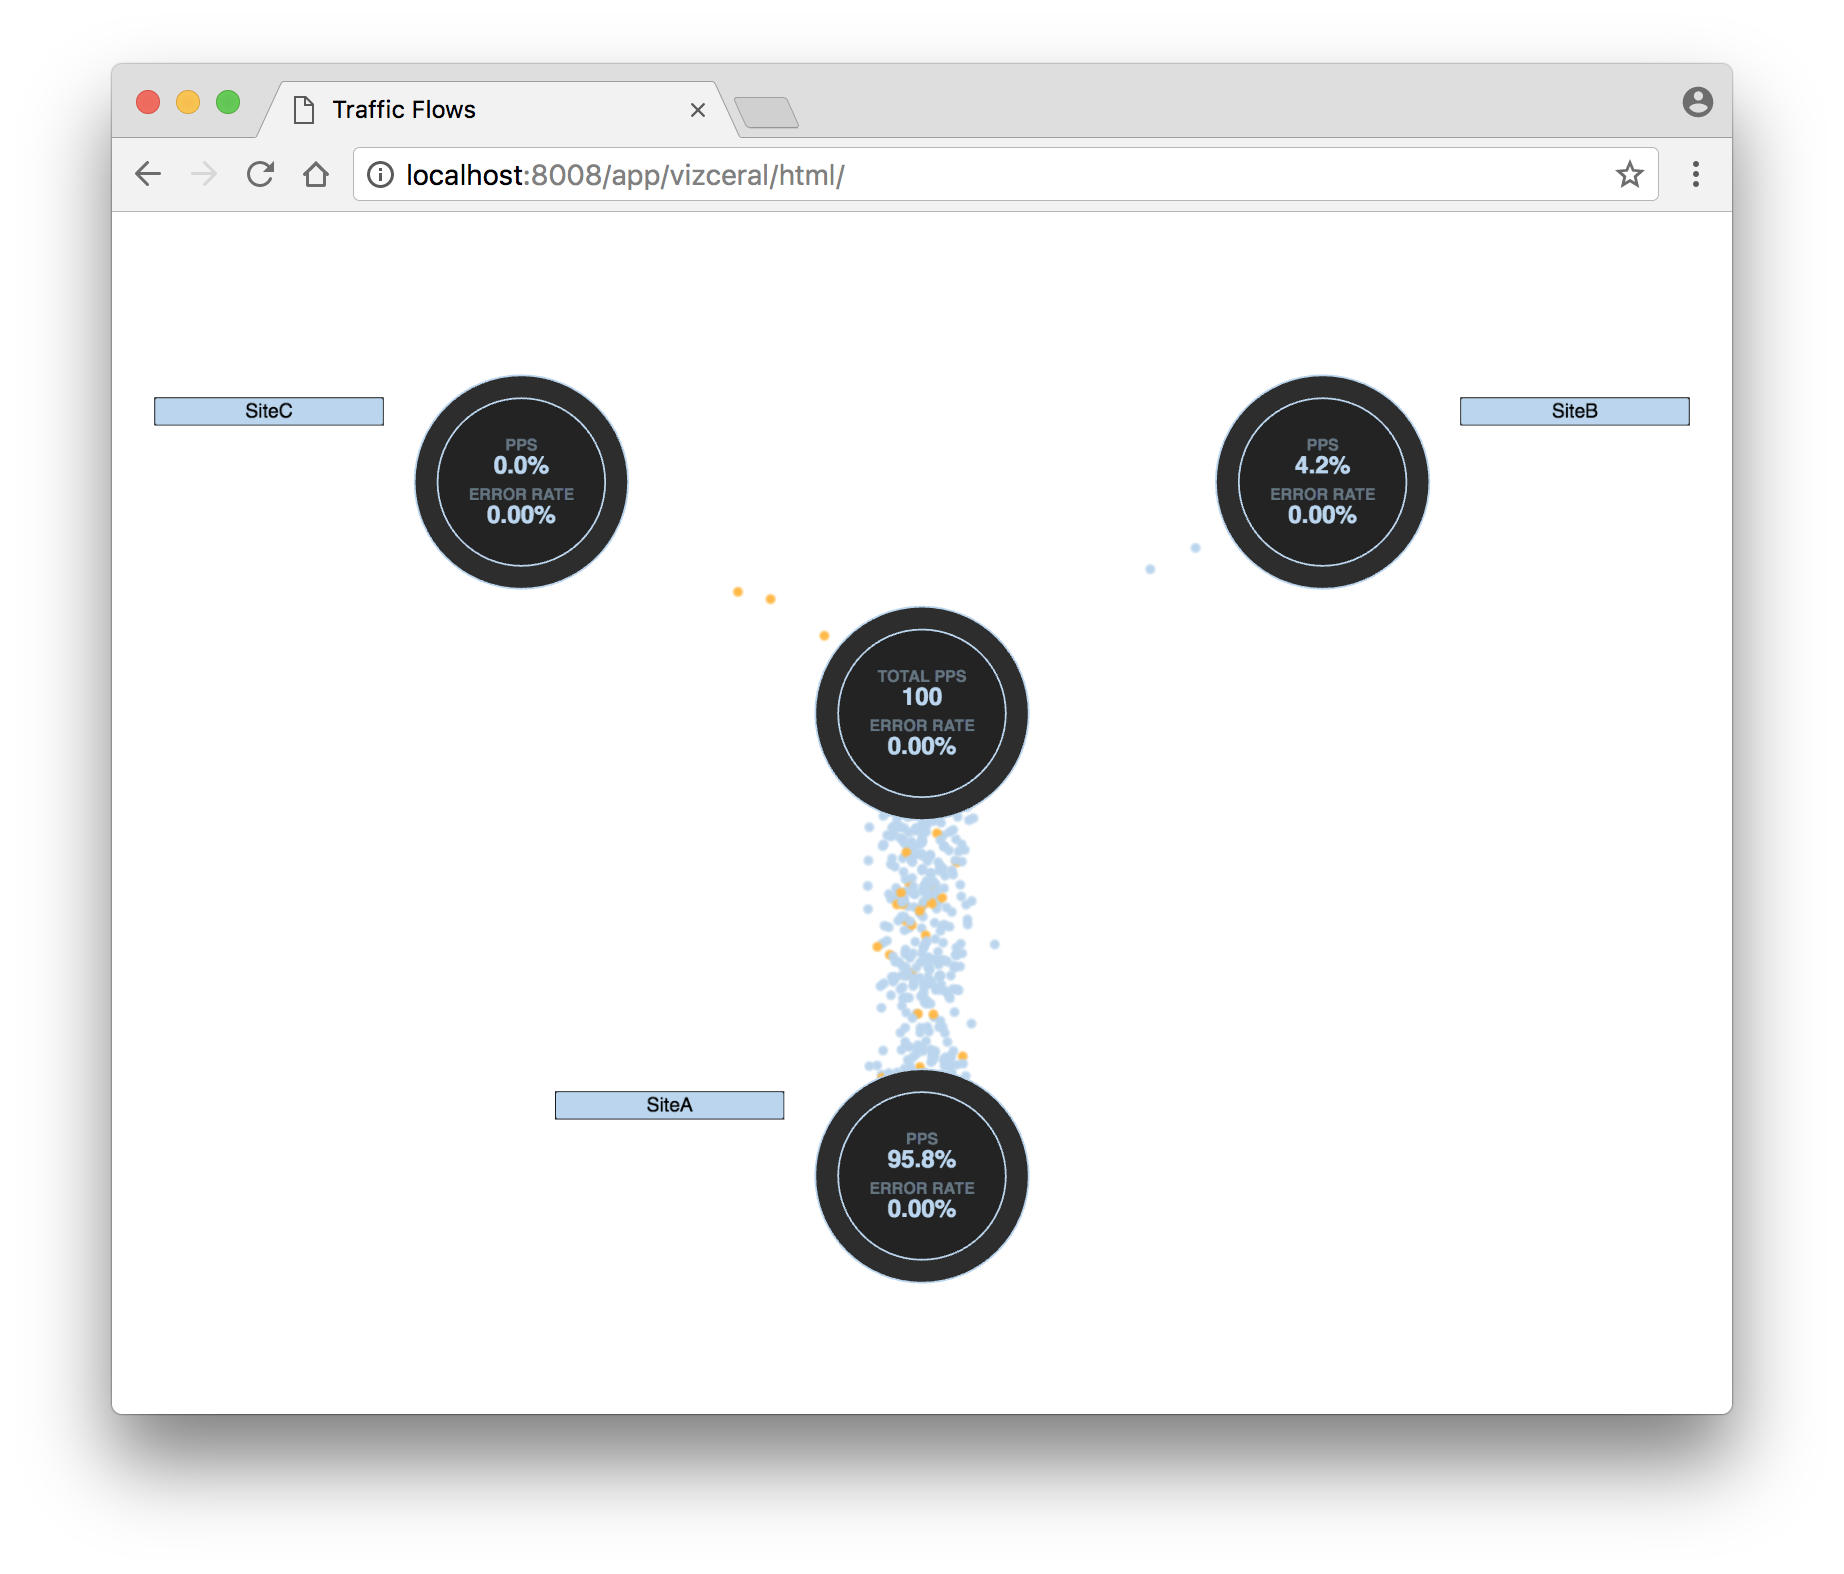
sflow-rt + vizceral
-
Netflix Vizceralを使用してリアルタイムのメトリックを表示するsFlow-RTアプリケーション
-
ドットのストリームは、インターネットとの間のパケットフローを表す
- ドットの色はパケットタイプを表す
- tcp/udp: ブルー
- icmp: イエロー
- その他: レッド
-
Docker
Makefile
NAME=sflow-rt docker
VERSION=0.0.1

run:
    docker run --name sflow-rt --restart=always -d -v $(PWD)/groups.json:/sflow-rt/store/vizceral~traffic.js/groups -p 6343:6343/udp -p 8008:8008 sflow/vizceral -Dviz.maxVolume=100000

clean:
    docker rm -f sflow-rt
groups.json- ここにsflowのip addressの範囲を書いて監視できる
- vizceralの円のところを管理できる
{
    "INTERNET": ["0.0.0.0/0"],
    "SiteA": ["10.0.0.0/16"]
}